Hi Kwet80,
Here are my opinions:
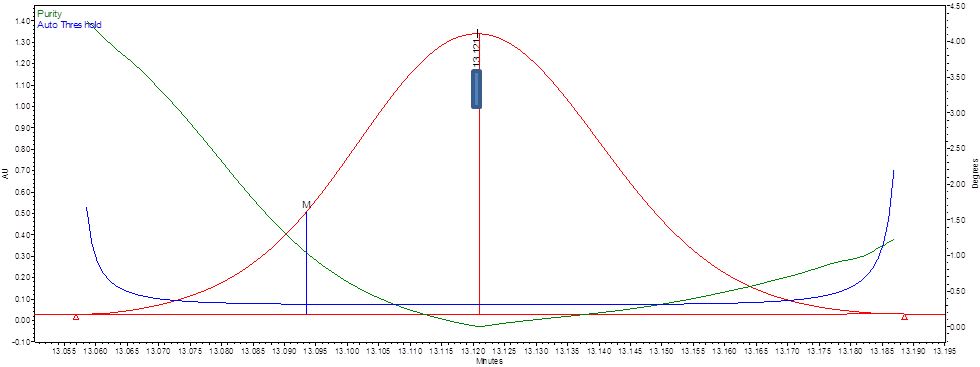
1. Undoubtedly, in the plot that is shown, there are two areas under the sample peak where the spectra differ markedly from the standard. What is unknown is how the standard was acquired for PDA analysis...that said, the plot shown indicates that there are probably at least two "coeluting species" within the peak shown, so this particular peak is not spectrally homogenous.
Purity Angle and Purity Threshold are both weighted average values, hence it is possible for a given Purity Angle to be less than a given Purity Threshold as more weight (mathematically) is applied to the peak apexes of the standard and sample. This phenomenon may be exacerbated if the absorbance values at the peak apexes in the standard and sample are too great...
2. If the standard used to compared this sample injection was gathered under similar conditions, there is an issue due to the absorbance(s) at the apex(es) of this peak (within the standard and sample). Spectral analysis validity using PDA comes into question when the maximum absorbance of the peak under analysis is greater than 1.0--this is typical for work employing spectrophotometric detection (as well as IR for spectral matching).
3. More work is needed to assess Method Specificity than what is shown here. Chemical Purity of a given peak in one separation employing PDA analysis is not guaranteed...indeed, a peak may be shown to be "spectrally pure" when it actually consists of mulitple chemical compounds, as in the case of syn-anti isomerism of Shiff bases (probably not the case here, just an example of what I have observed in my past). A second separation with another column (type) using PDA analysis (or MS) or perhaps GC (if applicable, which may not be the case for this work) provides far more certainty of Method Specificity than one Peak Purity PDA analysis alone. Spectral Matching would also add a nice piece of information in this particular case.
Suppose the plot below held a Purity Angle trace that was always lower then the Threshold Angle trace, and the Purity Angle was less than the Threshold Angle on a weighted basis...all that really means is that the observed peak May Be ASSUMED to be Spectrally Homogenous. A second separation with an "orthogonal" column or a different type of stationary phase that affords a similar result under PDA analysis (Peak Purity and Spectral Matching in conjunction) as what is suggested in the previous sentence would provide far more conclusive evidence of Method Specificity...MS of course would be better still in its own way.