


-
- Posts: 8
- Joined: Tue Nov 29, 2011 1:14 pm
Hi All,
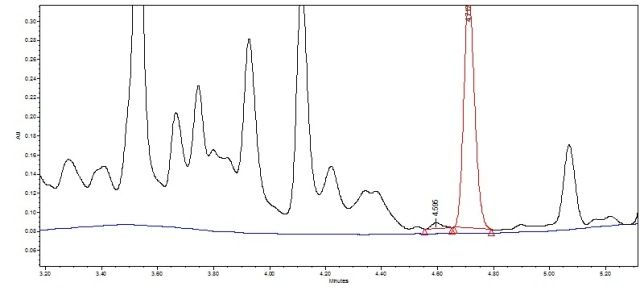
I’m currently working on development of HPLC method for assessing purity of active compound across purification steps (in process control). The method will only quantify active ingredient. The crude extract is a mix of many compounds and their spectra strongly overlap, so I have multiple peaks and wandering baseline. Well...that is most likely not a real baseline but despite all efforts I can’t get better resolution at the moment. It makes integration quite difficult, especially getting a baseline across all peaks. I have a problem with two minor peaks just before the peak of interest. If I establish just a local baseline for those three peaks (just like in Fig 1, overlaid blank in blue) and use drop method then peak of interest will not be baseline resolved, resolution will be around 1.1 and will fail suitability criteria of “not less than 1.5”. However, if I use valley-to-valley method (Fig. 2) then resolution will be around 1.9 and will pass. So I have a few concerns:
1.If I use drop method and stay with resolution around 1.1 would that be enough for method validation and acceptable by regulators as long as precision and accuracy be OK, despite regulator’s “recommendations” for higher resolution values. Or can I just use specification that “peak has to be visually resolved” instead of specifying a value?
2.I know that drop method would generate smaller error, but what if I use valley-to-valley method – would it be acceptable?
Has anyone validated method by using valley to valley without regulators concerns?
3.Is there any official document or guidelines that would specify which integration methods are allowed to use?
Thanks in advance for any replies.
Fig. 1
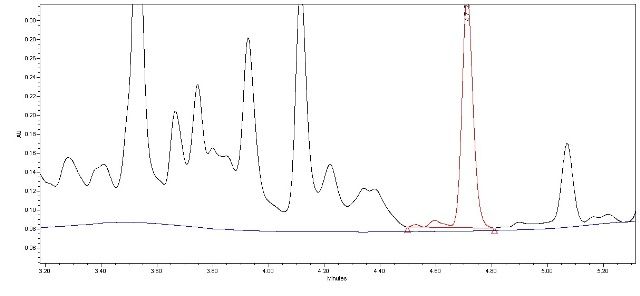
Fig.2
I’m currently working on development of HPLC method for assessing purity of active compound across purification steps (in process control). The method will only quantify active ingredient. The crude extract is a mix of many compounds and their spectra strongly overlap, so I have multiple peaks and wandering baseline. Well...that is most likely not a real baseline but despite all efforts I can’t get better resolution at the moment. It makes integration quite difficult, especially getting a baseline across all peaks. I have a problem with two minor peaks just before the peak of interest. If I establish just a local baseline for those three peaks (just like in Fig 1, overlaid blank in blue) and use drop method then peak of interest will not be baseline resolved, resolution will be around 1.1 and will fail suitability criteria of “not less than 1.5”. However, if I use valley-to-valley method (Fig. 2) then resolution will be around 1.9 and will pass. So I have a few concerns:
1.If I use drop method and stay with resolution around 1.1 would that be enough for method validation and acceptable by regulators as long as precision and accuracy be OK, despite regulator’s “recommendations” for higher resolution values. Or can I just use specification that “peak has to be visually resolved” instead of specifying a value?
2.I know that drop method would generate smaller error, but what if I use valley-to-valley method – would it be acceptable?
Has anyone validated method by using valley to valley without regulators concerns?
3.Is there any official document or guidelines that would specify which integration methods are allowed to use?
Thanks in advance for any replies.
Fig. 1
Fig.2
