Advertisement

LOQ determination

Discussions about GC and other "gas phase" separation techniques.

9 posts Page 1 of 1
In doing my first method validation I am tasked with determining the LOQ of a GC method. It was my experience that the bottom (lowest concentration) calibration point was where I was told to use for my least reliable value.
It was also my experience to quantify by "ignoring the origin" for the calibration curve since the lowest calibration point was the only point that I was sure of. In other words if I had a 1 mg/Liter lowest point, and my chromatogram had a result less than 1 mg/liter then I should properly report <1 mg/liter and not for example 0.66 mg/liter.
My question is based on my experiences listed above, how is the LOQ (limit of quantitation) anything other than the bottom calibration point?
How is the LOQ determined if not what I have been taught?

Thanks.
What if your lowest standard is still far from the origin?

You can search the forum for lots of arguments on this. I would encourage you to do that. There's a search box at the top of the page.

For me, the LOQ is the point where you are still sure that you're measuring what you think you're measuring, reliably. I've seen rules of thumb on this where people say "it's a real and reliably measurable signal if it's 10X the noise". I've had instances in my own hands where the S/N ratio was less than 10 and I could reliably measure the signal for the analyte it 10 times in row. In those cases, the mass spec. said it was the target molecule and I could reliably measure it so I had no problems sending out a number on it.

As for that intercept business. In chromatography, at zero concentration, you should have a response that is indistinguishable from the noise of your baseline. If you're really concerned about the low end of the calibrated range, you should be sure to include standards that are way down there. I would include my LOQ standard in the set if I was that concerned. Extrapolating to zero from standards that are far from the origin is not good practice. Including these low-concentration standards will help to guide your intercept toward zero. Mostly, far from the origin, the intercept tells you more about curvature in your calibration data than it does anything else. Ever get a negative intercept? How does that make any physical sense? Generally, it doesn't. Calibration data that is slightly concave upward will give you a negative intercept. If the data is concave downward, you'll get a positive intercept. The y-intercept is actually dictated by the average concentration and average response in your calibration set. That is a point that's relatively far from zero concentration. It doesn't make sense to me to use it. It makes more sense to try to figure out why your calibration data is nonlinear and is giving you a substantial intercept at all.

Here's an example of what I'm talking about. I added a little nonlinearity (5%) to data that should be a perfect straight line, no intercept. Slopes are close to 1 and the correlation coefficients are quite good. Note the sign on the intercepts:
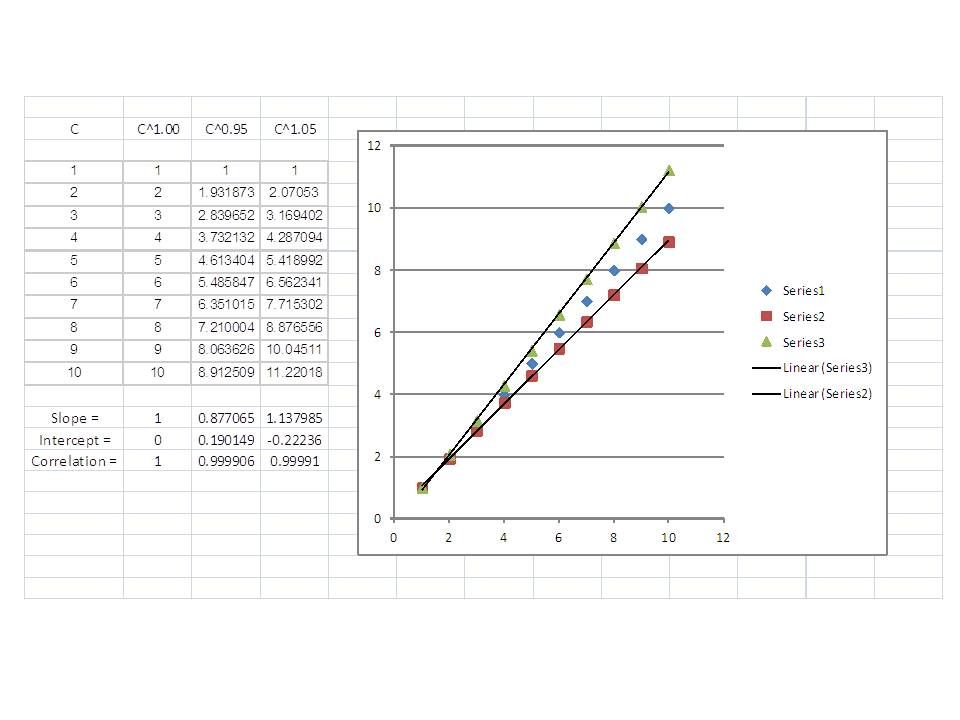
Image

I mostly work at the low-concentration end of my calibrated range. I use the method of standard addition a lot for calibration because my preferred sampling technique is SPME and it's quite matrix dependent. So, LOD and LOQ for me are all about S/N and what's the risk in me reporting something that's not accurate.
For me there is much physical sense in negative or possitive intercept.

Negative intercept represents that theoretically there is an analyte your are looking but there is no peak because the detector is not capable to see it. Sensitivity of the detector is too low. In this case unless the detector could detect a single particle of compound this effect could be present.

Positive intercept could represent for instances that there is something coeluting/interefere with you peak. So with no concentration of you anylate there is still a peak you could measure.
Non-zero intercepts can also be the result of a non-linear response (in which case a highrr-order fit would be required) or of heteroscedastic data over a wide range (in which case weighted least-squares may be a better approach).
-- Tom Jupille
LC Resources / Separation Science Associates
tjupille@lcresources.com
+ 1 (925) 297-5374
When I run purge and trap volatiles and have over 100 analytes, there will always be a mixture of analytes that give calibrations that are linear enough that average response factor gives accurate quantitation down even below the lowest standard, while some require a first order linear equation and can give positive or negative intercepts which will cause either a high or low bias at the lowest end of the scale, then there are others that require a quadratic equation and the accuracy is terrible if you have a result that is beyond either the high or low end of the calibration standards.

If you are doing work under EPA or NELAC you are required to have a calibration standard at or below your LOQ and when you run the standard as a sample it must quantitate normally within +/-50%, some methods stipulate +/-30%. This is to ensure that what you report is an accurate number. Anything reported below the LOQ is often given a qualifier marking the result as "Estimated" because you are in the area where you can detect the analyte, but not measure the concentration accurately. In an ideal situation your detector should be linear from zero concentration up to infinity, but I have yet to see an ideal situation with any analytical instrument, they all have limitations on their linearity.

rb6banjo- I like your examples, but what is considered "far from zero"? On some detectors 10 area counts is a good response while on others even 20,000 area counts may be in the questionable zone. Also one analyte may give 20,000 area counts at 1ug/l while another gives 10 area counts at 1mg/l on the same instrument.

Determining the true LOQ takes some experimentation. It can't be below the IDL(instrument detection limit) which should be the concentration that will produce a peak of at least s/n=3. If there is no prep, just an injection of the sample, then the IDL would also be the LOD. If you have to prepare the sample with an extraction technique, then you also have to know the average extraction efficiency. If you get 80% extraction efficiency on a normal basis, then the LOD for the method will be the IDL/0.8 to account for instrument sensitivity plus extraction efficiency. Since extraction efficiency may not be constant and can vary with analyte concentration you need to find the "noise" introduced by extraction which is the RSD of replicate preparations. For most applications the point where this "noise" causes the accuracy of measurement to fall below the +/-50% would be the LOQ and the range between the LOD and LOQ would be considered the Estimated Results range, where you are confident you have detected the presence of an analyte but can not be confident of the exact concentration.

This is why most consider the lowest calibration standard to be the LOQ, it gives a fixed cutoff in the accuracy, assuming the calibration curve is fit well enough to give accurate quantitation. The only way to know if the results are accurate below that level is to analyze a standard at a lower concentration and determine the accuracy. If it is still within acceptable limits then you can lower the LOQ and add the standard level to the curve, if not, then you are in the Estimated range. The other thing to consider is what concentration level is needed for the project. If you know that all samples will be at least 1ppm and you can detect to 1ppb, there is no reason to calibrate below about 0.8ppm, as this will provide you with a calibration that is fit for purpose for your project, but if you encounter a sample that is below 1ppm you either have to change your calibration and evaluate accuracy below that point or report results as Estimated or just <1ppm.
The past is there to guide us into the future, not to dwell in.
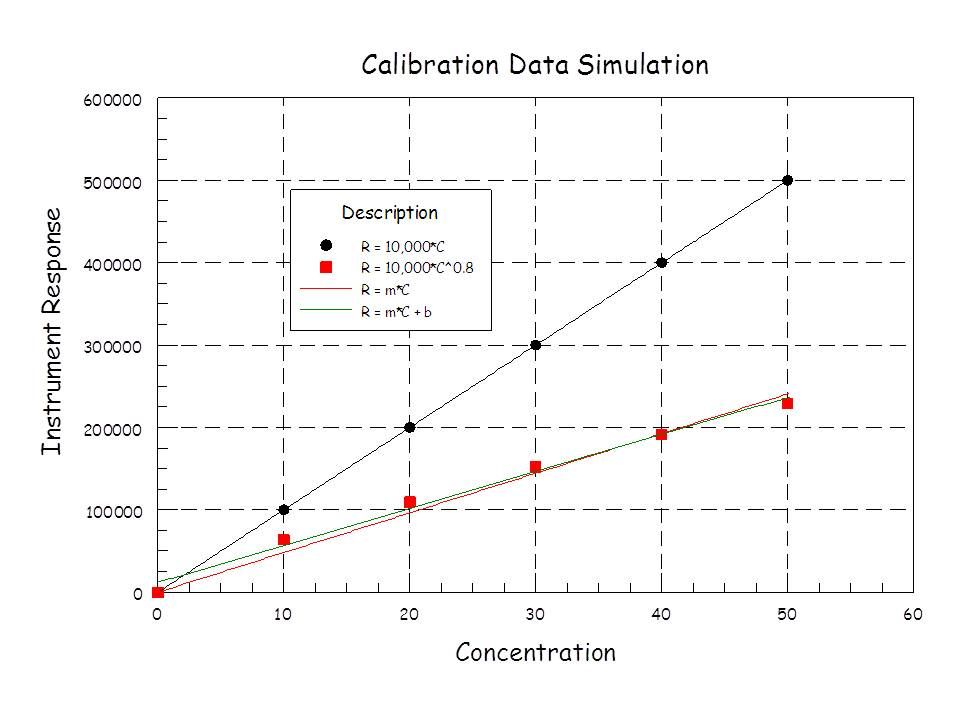
James-- "far from zero" just means what measured response do you have to have that's greater than the intercept so that you get meaningful estimations of the concentration of analyte in the sample. I generated some data by adding 20% nonlinearity. That sounds like a lot. Then, I calculated the regression constants for the various fits:

Image

The R^2 for each of the linear fits to the nonlinear data were greater than 0.99. You can see that y-intercept is starting to get big for 20% nonlinearity. What if you have an instrument response of 12,000 cts for your analyte that can be measured reliably? In this case, for the 2-parameter data you'd have to say that the concentration in your sample is undetectable. Whereas if you use the 1-parameter fit, the concentration is estimated to be more like 2.5. To get results that are not substantially skewed by subtracting the intercept, you need to be at 120,000 cts or so.

If you are interested in determining concentrations at the low end of your calibrated range, at the very least, you need to include standards that are down in that range. You can't calibrate far from zero concentration and then extrapolate down there. You have to drive that intercept down as low as you can get it. If you merely choose standards arbitrarily and then try to make predictions using only the regression constants, you can be in a danger zone at the low end.
I understand. I think we both have the same idea about it just different ways of expressing it. The calibration standards must fit the working range of both the instrument and the analysis parameters. Any reading below the low "far from zero" standard will have too much uncertainty.
The past is there to guide us into the future, not to dwell in.
Agreed. I fear that too many people calibrate somewhat "blindly" and just assume that since I have a model that projects down to zero concentration, that's is accurate down there. As I've reviewed the methods in my own department over the years, I've found these types of things.
I have seen the same thing. I reviewed some UV/Vis data once and noticed the two lowest points on the curve gave the same absorbance. When I questioned the analyst, they said it always did that but the curve fit was better than 0.995 linear so it was good. The detection limit reported was just below the lowest calibration point. I told them obviously it wasn't ok, because they were not seeing anywhere near the limit they were stating. Passing a quality control check and being valid are sometimes two different things entirely.
The past is there to guide us into the future, not to dwell in.
9 posts Page 1 of 1

Who is online

In total there are 63 users online :: 3 registered, 0 hidden and 60 guests (based on users active over the past 5 minutes)
Most users ever online was 4374 on Fri Oct 03, 2025 12:41 am

Users browsing this forum: Baidu [Spider], Bing [Bot], Google [Bot] and 60 guests

Latest Blog Posts from Separation Science

Separation Science offers free learning from the experts covering methods, applications, webinars, eSeminars, videos, tutorials for users of liquid chromatography, gas chromatography, mass spectrometry, sample preparation and related analytical techniques.

Subscribe to our eNewsletter with daily, weekly or monthly updates: Food & Beverage, Environmental, (Bio)Pharmaceutical, Bioclinical, Liquid Chromatography, Gas Chromatography and Mass Spectrometry.

Liquid Chromatography

Gas Chromatography

Mass Spectrometry