Help in interpreting a k' plot organic vs buffer
Posted: Tue Apr 30, 2013 6:38 pm
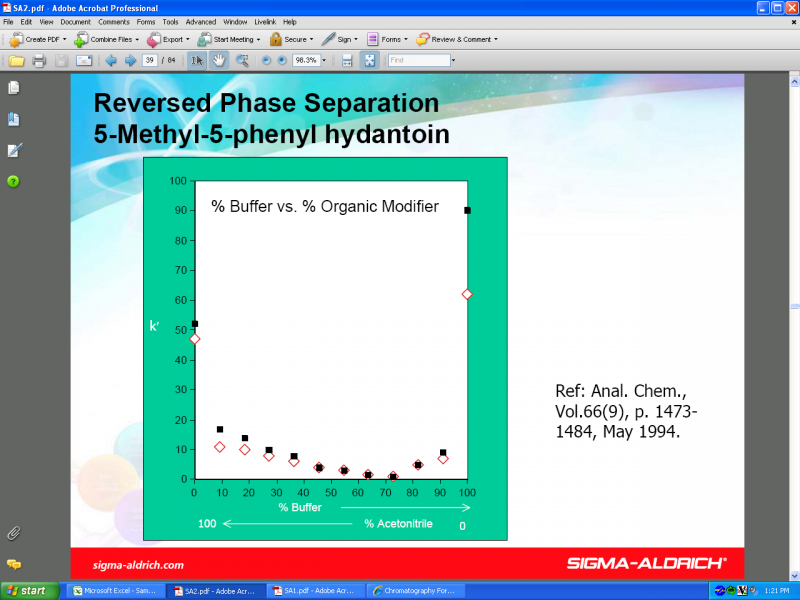
This plot describes k' as a function of %organic vs %buffer for the Sigma Aldrich line of Chirobiotic columns when used in reverse phase mode. I don't understand why we get k" maximas at 100% organic and 100% buffer. If this was a C-18 column in RP I would expect to see a linear graph. Does anyone know what mechanism is responsible for this?
One side question. Does the elutropic strength of various organic solvents in chiral RP the same as it would be in normal C-18 RP? ie would ACN decrease k' more than MeOH when using a Chirobiotic T column? I'm new to this technique and the available information is sparse. thx
One side question. Does the elutropic strength of various organic solvents in chiral RP the same as it would be in normal C-18 RP? ie would ACN decrease k' more than MeOH when using a Chirobiotic T column? I'm new to this technique and the available information is sparse. thx

