Advertisement

LOD LOQ and HPLC area under the curve measurement

Discussions about HPLC, CE, TLC, SFC, and other "liquid phase" separation techniques.

11 posts Page 1 of 1
Hello,

I just have two simple questions:
1. How to measure the area under the curve if you have two spikes that are not very well separatedImage 
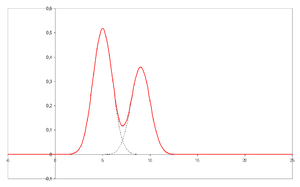
like in the image? Do you measure like usual or you separate the two spikes with a vertical line that goes down to the baseline and measure the area like that? What if the baseline is not really horizontal and you have noise on it, how do you measure then?
2. Is it possible to calculate LOD and LOQ in HPLC using the Mean + 3*Sigma and Mean + 10*Sigma, if yes what exactly can you measure in the baseline noise to get an area under the curve and where do you measure it?

Thank you
2 simple questions with a not so simple answer.
For your first question: there are written lots of articles about how to deal with such situation.
This ranges from "use a dropdown" to "sophisticated algorithms based on the peak shape".
Do a google search, and you will find lots of info.

For your second question: LOD is the lowest concentration you can detect.
I think you should ask yourself some questions: do you need to know the lowest concentration of peak A when peak B is at high concentration, or do you need the lowest concentration of A en B when they are both low.
I think the best way is to make a calibration curve and use the standard error and slope of the calibration cuve.
Or use sufficient low concentrations to get separated peaks.

Ace
To question 1: The ONLY way to ACCURATELY measure the peak areas is to improve your separation :wink: .
For partly overlapped peaks you may use a baseline drop, exponential skim, whatever your CDS provides - it will always be more or less "guesswork". YOU have to judge, which integration method is the best in each particular case :(
If you have to defend your data, you might use a risk-based approach, e.g. using two different integration methods to yield minimum/maximum possible peak areas for each peak and evaluate both.
And don't forget: depending on your analysis, evaluation via peak height may be a possibility, too.
To buttress HPLCaddict's post, a "standard" text on integration methods says the following:
“. . . errors arising from peak overlap are introduced by the algorithms of perpendicular and tangent separation and cannot be eliminated by anything but better chromatography. Integrators are able to generate a highly precise and totally inaccurate set of results for all the foregoing examples.”

Dyson, Chromatographic Integration Methods, 2nd ed. , pg 67; RSC Monographs (1998)
-- Tom Jupille
LC Resources / Separation Science Associates
tjupille@lcresources.com
+ 1 (925) 297-5374
I still find it shocking, though, that hplc software routinely encourages very inadequate solutions (indiscriminate use of a drop-down at the valley), while the more sophisticated options get sidelined. Of course we should improve our chromatography, but there are sometimes situations where we absolutely cannot. Here we ought to use the best approximation we can, and make use of the data as best we can (we do have a lot of information about peak-shape, all of which hints at what's going on during the overlap; ignoring the data certainly can't improve our understanding).
we do have a lot of information about peak-shape, all of which hints at what's going on during the overlap
But that's the problem; we *don't* have a lot of information about the underlying peak shape! They are *not* Gaussian, they usually tail. And the distribution of the tail will be different if it comes from gross overload versus silanols versus extra-column volume versus . . . We have to make assumptions, which introduce their own errors.

Just as a quick example, for a small peak after a big peak, if both peaks are Gaussian, a perpendicular drop will *underestimate* the area of the smaller peak. But if the big peak tails sufficiently, the perpendicular drop will *overestimate* the area of the smaller peak. How much tailing does it take to go from underestimating to overestimating? That depends on mechanism (and hence detailed shape) of the tailing.

If you want to get into it (and are willing to deal with eye-glazing math!), get a copy of the Dyson book and read the section on integration algorithms.
-- Tom Jupille
LC Resources / Separation Science Associates
tjupille@lcresources.com
+ 1 (925) 297-5374
Yeah, I know it's contentious. But it's exactly books like that that i'm thinking of; in many cases we can actually calculate if there is tailing because there's enough curve available to see whether its shape conforms to a Gaussian (plus the sum of some other Gaussian with a different position). The process is just like looking for non-random residuals in a calibration curve to see if the curve is really the shape expected, and we can do it because we've (fortunately) insisted on having 15 or so measured points across each peak, so we have far more data-points than we have variables in two tailing Gauss-curves (we need 4 variables for each peak). It just bothers me that I've yet to see a standard HPLC package that follows-up on its "drop a perpendicular from the valley" option by issuing warnings when the result is sure to be bad, either because of tailing or strongly unequal peaks.

What we shouldn't do is guess whether the perpendicular is better than a skim (etc.), because humans find that a hard judgement call. Perhaps that's why the more cautious chromatographers simply don't touch these options at all, and refuse to quantify without first improving chromatography (what merit is there in a measurement that might be wrong, but we don't know?)

The maths is slightly eye-watering for a non-mathematical person, but one hopes that the writers of HPLC software are prepared to get to grips with it. Otherwise there's little point in anyone writing the books.

Sorry to rant, but it's one of my hobby-horse subjects.
For any sample preparation fancier than dilute and shoot my guess would be that for peak sizes and overlaps similar to those shown, dropping a vertical would be the least of the sources of innaccuracy.

Peter
Peter Apps
for peak sizes and overlaps similar to those shown, dropping a vertical would be the least of the sources of innaccuracy.
You're quite right, Peter, but then those peaks are Gaussian!
(what merit is there in a measurement that might be wrong, but we don't know?)
If the calibrators and samples are treated identically, and if we make sure to "bracket" samples with calibrators (and if the moon is in the seventh house, and if Jupiter aligns with Mars), there is considerable merit in being consistent: if we're wrong the same way every time, then the errors will cancel out. That said, I agree with you that the real solution is improving the chromatography.
-- Tom Jupille
LC Resources / Separation Science Associates
tjupille@lcresources.com
+ 1 (925) 297-5374
for peak sizes and overlaps similar to those shown, dropping a vertical would be the least of the sources of innaccuracy.
You're quite right, Peter, but then those peaks are Gaussian!
And not so badly resolved, or very different in area, so all in all not a very challenging case.

Peter
Peter Apps
We have had discussions on setting the start and end of peaks manually or electronically. Most people seemed to be "rooting" for doing it only electronically to keep the individual opinion out of the process (of course, the software also has someones opinion in it, the only difference being that for a given software this does not change anymore).
I mentioned before, that (a long time ago) I got a curve fitting software that was supposedly resolve areas of overlapping peaks. When I tried to use it, it became clear that the software made a lot of assumptions which I did not want to follow. So I never applied it, which also means that I agree with Dyson.
Referring to the relatively simple example given in the initial post who will decide when the areas are too different to still use dropping a vertical?
11 posts Page 1 of 1

Who is online

In total there are 4 users online :: 3 registered, 0 hidden and 1 guest (based on users active over the past 5 minutes)
Most users ever online was 4374 on Fri Oct 03, 2025 12:41 am

Users browsing this forum: Ahrefs [Bot], Bing [Bot], Semrush [Bot] and 1 guest

Latest Blog Posts from Separation Science

Separation Science offers free learning from the experts covering methods, applications, webinars, eSeminars, videos, tutorials for users of liquid chromatography, gas chromatography, mass spectrometry, sample preparation and related analytical techniques.

Subscribe to our eNewsletter with daily, weekly or monthly updates: Food & Beverage, Environmental, (Bio)Pharmaceutical, Bioclinical, Liquid Chromatography, Gas Chromatography and Mass Spectrometry.

Liquid Chromatography

Gas Chromatography

Mass Spectrometry