Page 1 of 2
How to handle missing spectra
Posted: Mon Jun 21, 2010 8:49 am
by perfumer
I'm working with a quite old NIST05 library, doing perfume analysis.
There are quite some spectra I can't identify. Knowing that my Varian Saturn 3 MS is now quite nicely calibrated and even the GC is good, these must be substances with records not yet in the library.
Let me give you one example:
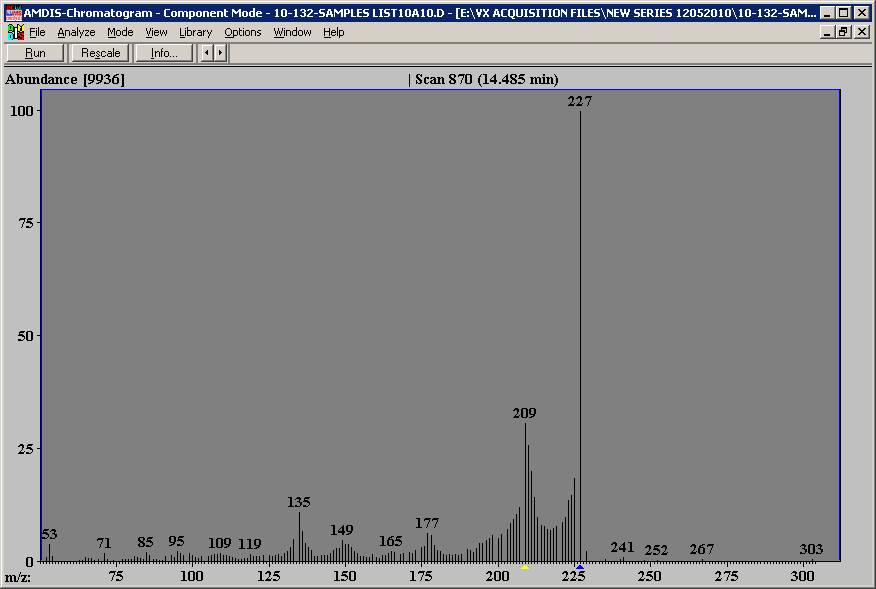
I asked a friend to check this spectrum with a FFNSC (a fragrance and flavor library) and he had no hit as well. The substance is supposed to belong to the "Jasmonate"-family, e.g. Paradisone [(+)-methyl dihydroepijasmonate], CAS: 39647-11-5 or dihydroisojasmonate, CAS: 37172-53-5, - however, it is NOT a jasmonate and the spectra of this group of substances looks totally different anyway.
My question is: how do I find out, what I have here? Is there a book explaning how to determine the structure from the spectrum? Is there a computer application able to calculate the structure?
I was always wondering if it is possible to calculate a spectrum from a given formula and vice versa. I did not study chemistry -just physics - and this was 20 years ago. Thanks a lot for a hint!
Posted: Mon Jun 21, 2010 10:26 am
by Peter Apps
In any complex sample (such as a perfume that contains natural ingredients) you will get "no hits", and identifications that are obviously nonsense when you have very close co-elutions of different compounds. The most elegant solution o the problem is heart cutting 2-dimensional chromatography which gives cleany separated peaks on a clean baseline.
I leave MS interpretation to the experts, but from the odd look of the spectrum I'd suspect some chlorine in the molecule.
Peter
Posted: Mon Jun 21, 2010 5:32 pm
by yangz00g
We are in similar industry. Your case is not unusual, but very common for a given complex flavor or fragrance sample as Peter said.
Using nomial mass to determine formula is very difficult, if not impossible, because there are too many possible formulas corresponding to a given nomial m/z. If you have good experience with organic synthetic chemistry, you can give it try. Otherwise, seeking high-res MS data is the best way.
Posted: Mon Jun 21, 2010 7:37 pm
by Cmdr Keen
What does the peak look like? Is it possible that you have two (or more) substances at the same retention time? Try to view some charakteristic masses in a fragment mode and have a look if they show their maximum at the (exactly) same retention time.
Otherwise - if you're sure it's just one substance - I agree, nothing will help but performing some MSxMS or MSxMSxMS analysis.
Posted: Mon Jun 21, 2010 11:10 pm
by Don_Hilton
This spectrum shows no molecuar ion. While the signal at 227 looks it might be the higest mass ion - you can not have irrational losses. and significant abundances at M-4, M-5, etc would have to be irrational losses. While AMDIS is very helpful, it can be kind of tricky to use - and it will identify more peaks than are present if you are not careful.
This looks like a part of a spectrum of something without much aromatic character or an artifact resulting from noise.
If you can get a chemical ionization spectrum, you may be able to get a better idea of 1) how many compunds are eluting in the region and 2) the molecuar weight of them.
Posted: Tue Jun 22, 2010 5:53 am
by ChromatographyDude
Can't help but wonder if it might be a phthalate contaminant (diethyl phthalate - 149 & 177 m/z) co-eluting with something else and giving this spectra?
Posted: Tue Jun 22, 2010 12:23 pm
by perfumer
Thanks a lot for all the hints and considerations, this is very helpful. However, may I dare to exclude some of the suggested problems.
First, it is not a complex perfume sample at all! Coelution could be excluded to a high degree since I did a high-resolution GC of this (suspected to be pure) substance solved 1:20 in HPLC grade MeOH and just got one sharp, clean peak showing this very spectra allover that peak. I also used the (very helpful) AMDIS feature of checking the consistency of certain m/z over the peak, so it is just this substance, nothing else.
I'm also reasonably positive that the substance is a fragrance raw material (it was sold to me as "(+)-methyl dihydroepijasmonate") and does have a quite pleasant smell. But it is not (+)-methyl dihydroepijasmonate, that one looks entirely different, as I could verify.
I'm stuck, as it seems.
Posted: Tue Jun 22, 2010 1:52 pm
by AICMM
perfumer,
In my opinion you have too many ions. I make absolutely no claims on MS expertise (as it is just a fancy detector for a GC, ;>)) but I do firmly believe you have way too many fragments. For another neat component, the total abundance is on the order of 9900 for the same split ratio and dilution factor? Did you background subtract the spectra to eliminate noise and bleed? Is your threshold set high enough?
Best regards.
Posted: Tue Jun 22, 2010 3:28 pm
by Peter Apps
Hi Perfumer
So if its not the compound that it says on the label, who is to say that it is pure ? It's not likely that you would get a complete co-elution but it's not impossible either and I wouldn't rule it out until I had run it on a different column, or at least with a drastically different temperature programme.
I now realise that I was talking through my *ss about the chlorine - sorry. I think that most of the smaller peaks, with the neat variation in intensity, are not part of the spectrum at all.
How does the retention index match up ?
Peter
Posted: Tue Jun 22, 2010 4:14 pm
by JI2002
I searched the Agilent MSD Chemstation library for CAS 39647-11-5, there is no match found. Searched NIST webbook and found the following:
http://webbook.nist.gov/cgi/cbook.cgi?I ... =SI&cMS=on
There is no mass spectrum available for this compound.
I don’t think you need to ID the peak because you bought the chemical pure. If you do, you need to follow the advice from yangz00g and Cmdr Keen. But I do think the solution you made was too concentrated. Dilute the solution 100X and try again, you should get a much better spectrum.
Posted: Tue Jun 22, 2010 10:55 pm
by Don_Hilton
If you have a single major component be sure it is dilute enough. If you saturate a mass spec detector, you get some strange stuff and ion ratios go crazy. AICMM describes this as too many ions. I look and see the curving pattern between major intensities - either way, it looks like something is unusual. Look at the traces for the major ions shown and some of the minor ions and see if they track together. If some seem to flatten off while others rise and fall through the center of the peak, you have saturation of the detector.
20:1 in solvent is really concentrated for mass spec. Figure that you want nanograms to tens of nanograms on column.
Re: How to handle missing spectra
Posted: Wed Jun 23, 2010 5:17 am
by bhuvfe
My question is: how do I find out, what I have here? Is there a book explaning how to determine the structure from the spectrum? Is there a computer application able to calculate the structure?
I was always wondering if it is possible to calculate a spectrum from a given formula and vice versa. I did not study chemistry -just physics - and this was 20 years ago. Thanks a lot for a hint!
Aren't you saturating your ion trap at 5% concentration?
You can get a decent spectrum on a single quad at that concentration if you take maybe the beginning (or the tail of the peak) but I don't think you can get away with it with your instrument.
Answering your questions.
Since the quantity of sample available in your case is not a problem the combination MS+NMR should give you an answer.
There's a book
http://www.amazon.com/Interpretation-Ma ... =8-1-spell (or any other edition). This will give you a flavor of the rules but probably will not help you with your strange spectrum.
Software to calculate spectrum from structure exists (as far as I know) only for NMR and it works for relatively simple molecules (from ACDlabs).
Posted: Wed Jun 23, 2010 7:30 am
by chemstation
If you have access to a Chemical Ionisation MS, you can use it to ascertain the MW of the compound, as per Don_Hilton noted observation.
I don't know how stable fragrance chemicals are when exposed to methane as the CI gas, but if you can find someone with Ammonia or IsoButane, (they have the best characteristics in keeping you compound from fragmenting so as to determine the pseudo-molecular ion.),
You could then determine not only the MW, but potentially the purity of the peak. as future clues to ID the chemical.
and as bhuvfe pointed out, NMR should be used to confirm the structure.
Alex
Posted: Wed Jun 23, 2010 3:06 pm
by perfumer
Thanks again! As many of you pointed out, I completely overloaded my Ion Trap. This led to the "wave like" tail on the left side of the peak.
I'm sorry I bothered you with a wrong spectra, but thanks for your patience and explanation!
I'll repeat the measurment with higher dilution/split.
JI2002, thanks for the link. Is there a way to see mass spectra from that link?
Posted: Wed Jun 23, 2010 4:30 pm
by JI2002
Sometimes I use NIST webbook to search for mass spectrum of a compound if I know its formula, name or CAS number. Unfortunately there is no spectrum available for the compound in the database. This is not unusual though. You can submit your data to NIST for inclusion in the next version of library database.
From the link below, click on CAS registry number, then enter CAS and select mass spectrum, click on search.
http://webbook.nist.gov/chemistry/