GCMS chromatogram fig. making using alternative software.
Posted: Sat Dec 28, 2024 6:30 am
by Viboye
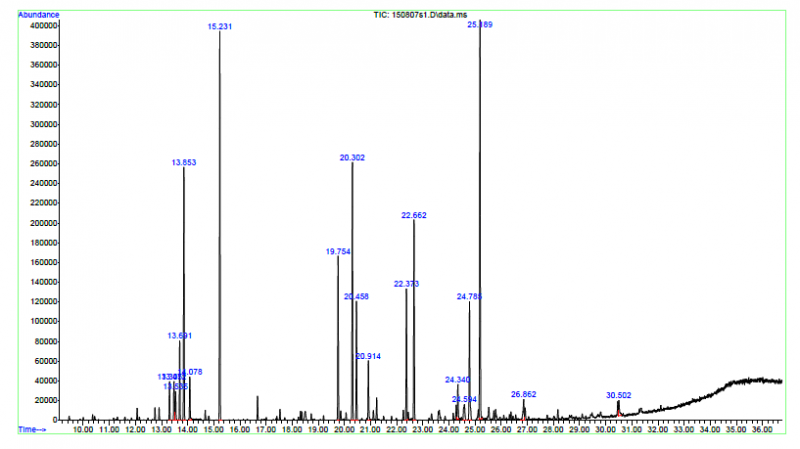
Hi everyone. I am facing problem with my GCMS data figure. I lost the figure but I have still the data (R. Time, Area %, m/z and Compound Name). How can I make the figure of chromatogram by which software or visualizer can I get the figure.
Please mention.
I have given a picture below which is like my lost figure.
Re: GCMS chromatogram fig. making using alternative software.
Posted: Sat Dec 28, 2024 11:31 am
by Hollow
Hi
With only those, already processed, data, you can not rebuild the raw chromatogram.
What you would need is the the raw data, that's retention time and TIC-intensities (or intensities per each mass; TIC then is the summ over all single masses)
With that, you can basically use Excel (maybe not practicable due to its limitations and horrible lchart looks) or any other chart drawing/statistical software like R/R-studio.
Maybe the easiest way would be to use OpenChrom, if the data can be imported from a raw, selfbuilt csv file (don't know); if you have the original data-file, then OpenChrom should be able to use that natively.
Re: GCMS chromatogram fig. making using alternative software.
Posted: Sat Dec 28, 2024 11:37 am
by antonk
Our UniChrom supports reading and visualizing Agilent MS data files
https://www.unichrom.com/matrix-mse.shtml
Vector graphics for GC/MS data is discussed here
https://www.unichrom.com/calc/calce.shtml
Simlest way to get the graphic into clipboard - activate TIC or mass-spectra (click on graph) and select main menu Edit/Copy