-
- Posts: 11
- Joined: Sat Jul 01, 2006 12:21 am
Hello,
I'm new to chromatography, but got some strange FID results on our new varian 3800 GC with FID, PFPD and TCD.
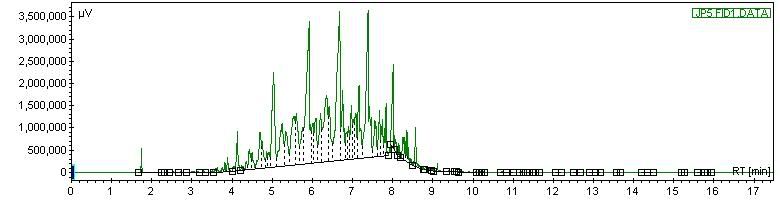
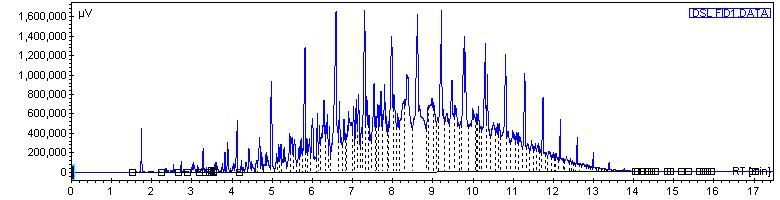
I was running some JP-5 fuel, which is high flashpoint military jetfuel. I ran it straight with a 20 split through the FID and got a beautiful chromatogram. However, I wasnt sure which hydrocarbon was which, so I added some pure octane into a vial of JP-5.
I put about 1 mL of JP-5 in there, and somewhere between 0.25 and 0.5 mL of octane - I didnt measure it.
On the orignal chomatogram, the peak which I later identified as C8 was very small, only about 2000 - just high enough to see, as the other higher hydrocarbons in there were all right around 3.5 million.
On the sample that I doped with octane, the method was exactly the same. In this one, we got a large peak which was C8 - 6.5 million. However, the other peaks for other hydrocarbons were exactly the same height as in the first chromatogram, and just as beautiful. We overlaid the chromatograms, and other than the C8 peak, the chromatograms laid EXACTLY on top of each other, it was perfect.
So my question is, say I diluted the JP-5 by 20 to 30 percent... Shouldnt the peaks for the other non-c8 hydrocarbons have decreased by some similar factor? If I was running a PFPD and diluted a sample, the peaks would reduce proportionately... but it didnt occur in this FID test.
Do hydrocarbons register in a different way in an FID detector, that given a split ratio and temperature profile, hydrocarbons show up with a specific height peak regardless of concentration???
Or did I just dilute at exactly the right ratio to get a nice peak without effecting the peaks? I dont see how that could be possible.
Thanks for any insight you can give!
JMH
I'm new to chromatography, but got some strange FID results on our new varian 3800 GC with FID, PFPD and TCD.
I was running some JP-5 fuel, which is high flashpoint military jetfuel. I ran it straight with a 20 split through the FID and got a beautiful chromatogram. However, I wasnt sure which hydrocarbon was which, so I added some pure octane into a vial of JP-5.
I put about 1 mL of JP-5 in there, and somewhere between 0.25 and 0.5 mL of octane - I didnt measure it.
On the orignal chomatogram, the peak which I later identified as C8 was very small, only about 2000 - just high enough to see, as the other higher hydrocarbons in there were all right around 3.5 million.
On the sample that I doped with octane, the method was exactly the same. In this one, we got a large peak which was C8 - 6.5 million. However, the other peaks for other hydrocarbons were exactly the same height as in the first chromatogram, and just as beautiful. We overlaid the chromatograms, and other than the C8 peak, the chromatograms laid EXACTLY on top of each other, it was perfect.
So my question is, say I diluted the JP-5 by 20 to 30 percent... Shouldnt the peaks for the other non-c8 hydrocarbons have decreased by some similar factor? If I was running a PFPD and diluted a sample, the peaks would reduce proportionately... but it didnt occur in this FID test.
Do hydrocarbons register in a different way in an FID detector, that given a split ratio and temperature profile, hydrocarbons show up with a specific height peak regardless of concentration???
Or did I just dilute at exactly the right ratio to get a nice peak without effecting the peaks? I dont see how that could be possible.
Thanks for any insight you can give!
JMH